In this post we’re looking at the file length information and how to configure warnings for it. The file length information is one of many ways Sw!ftalyzer helps us finding potential areas of improvement in our app.
First, we’ll see how Sw!ftalyzer shows file lengths as a histogram. Next, we’ll explore how to use the warnings feature to find files with too many lines.
Getting an Overview of File Lengths with Sw!ftalyzer
We’ll use a demo project analysis as an example. Download the analysis file and open it in Sw!ftalyzer to explore the analysis: Demo Project
The project consists of three files:
- Repository.swift
- Service.swift and
- ViewController.swift
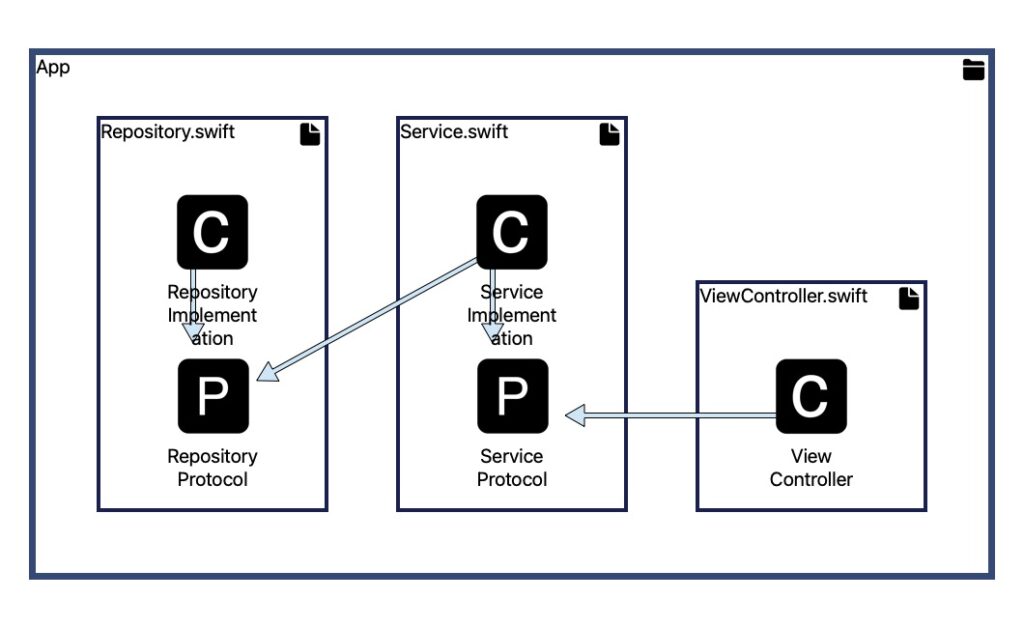
The first one contains the protocol RepositoryProtocol and the implementing class RepositoryImplementation. Next, the class ServiceImplementation has a dependency to RepositoryProtocol. It’s declared in the file Service.swift together with the protocol ServiceProtocol that it implements. Finally, the class ViewController is part of ViewController.swift and uses ServiceProtocol.
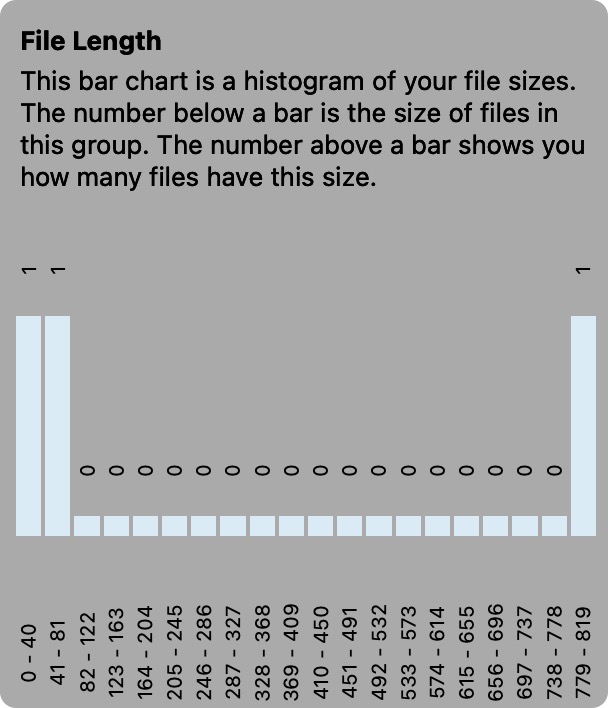
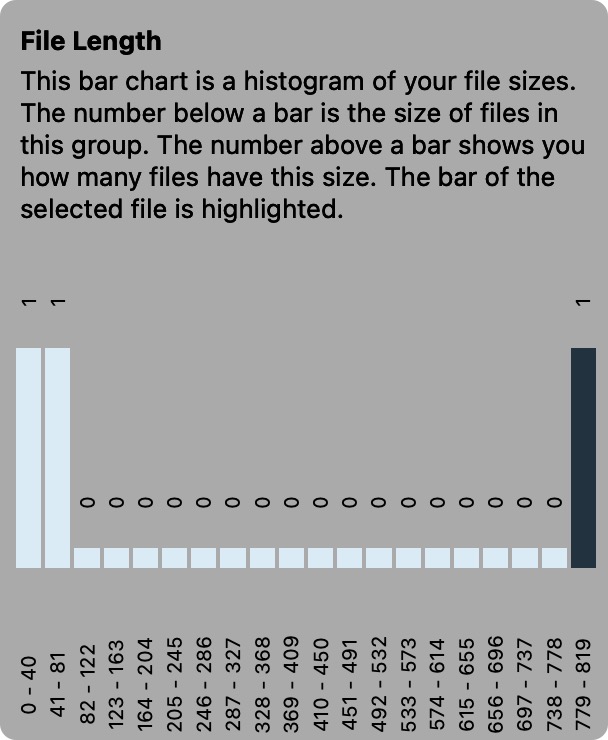
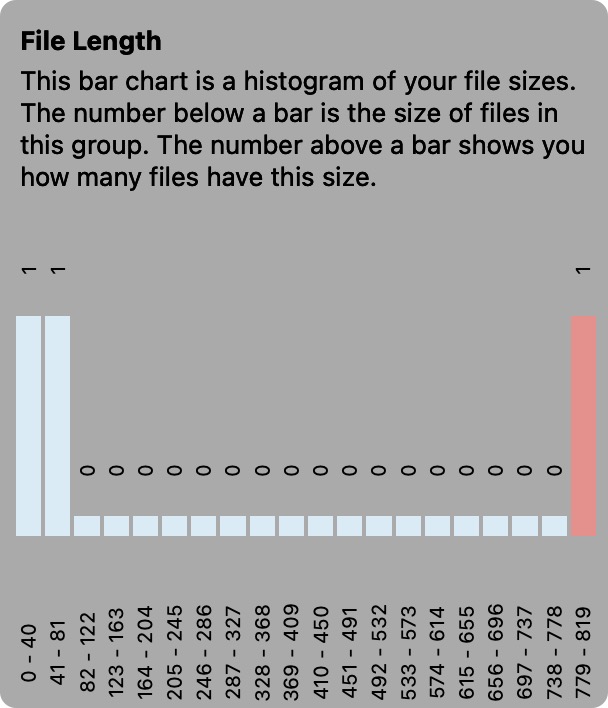
Below is how Sw!ftalyzer visualises this project. We can see the files, protocols and classes with their dependencies as described above. Next to it is a bar chart showing the file lengths of all files in the analysed project as a histogram. A histogram is a chart displaying the distribution of numerical data grouped in bins and represented as bars. In this case each bar represents the files in a bin and a bin is defined by a range of file lengths. The number above a bar shows us exactly how many files are in a bin.
In this example there’s one file with a length of 0 – 40 lines, one with a length of 41 – 81 lines and one with a length between 779 and 819 lines. Our goal is to identify the file that falls into the last bin and is significantly longer than the other files.
The length of a single file wouldn’t allow for such insides. Having an overview of the lengths of all files in such a histogram helps us to spot outliers. This gives us more context than looking at each file individually and it’s an information we can’t get with many other analysis tool like SwiftLint.
One way of finding the outlier is to go to the selected node tab, which is the first tab in the right panel. Here we can see information about the selected node. When selecting a file node in the graph, we can see the histogram from above but with one bar highlighted. This highlighted bar shows us the file length of the selected file node.
Clicking through each file to find the one we are looking for is possible with only three files. However it’ll get quite tedious when dealing with hundreds of files. This is where the file length warning comes into play. It allows us to easily configure when to show a warning that highlights files with too many lines. Let’s take a look at how to use and configure this warning.
Configuring Warnings about File Lengths
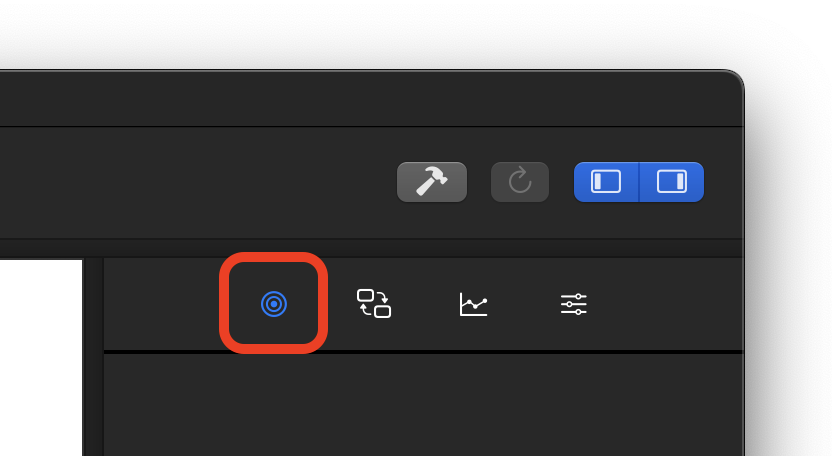
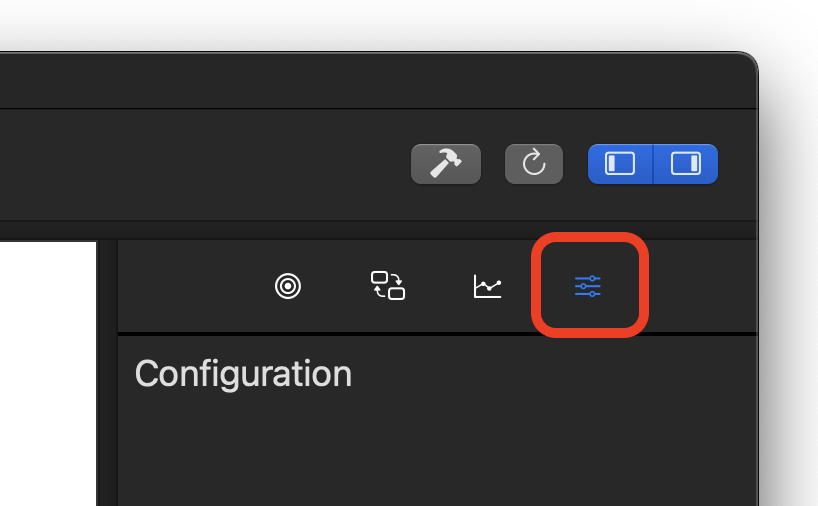
Select the configuration tab. It’s the fourth tab in the right panel, which is bordered in the image.
This configuration tab allows us to configure warnings. Among others, one of them being the file length warning, which we can see in the next image.
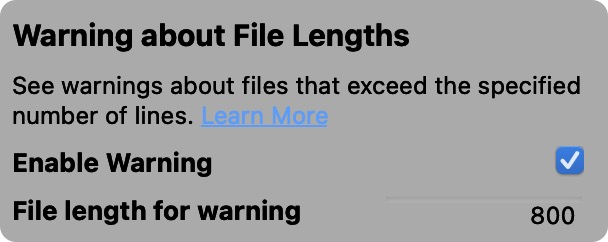
There’s a checkbox to enable or disable the warning. It’s selected by default meaning that a warning is shown next to each file node that exceeds a given file length. Unselecting this checkbox removes all warnings about file lengths in the dependency graph.
The file length to trigger a warning is set in the text field below the checkbox. Initially, the text field for the number of lines is empty so that no warning is shown regardless of the file length. To find the long file in the demo project, we enter 800 into it.
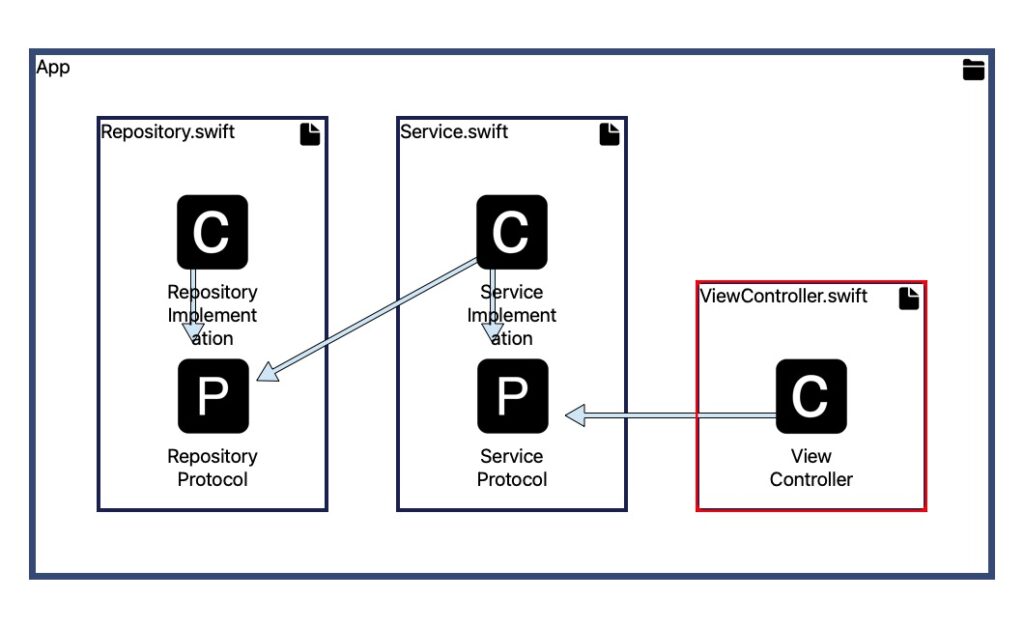
After changing the file length to trigger a warning to 800, we can see a red bubble appearing next to the file ViewController.swift. This highlights the node that’s now affected by the warning, so that it’s easy to find it.
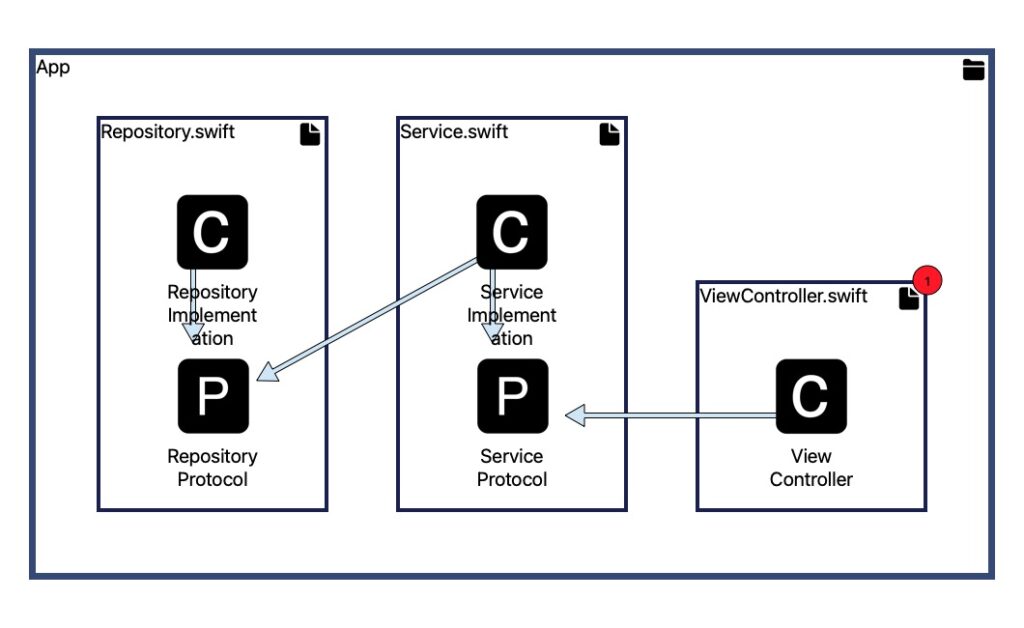
We now know that it might be worth taking a look at the file ViewController.swift. It looks like it’s doing a lot of things and we can improve the app by separating its code into multiple code entities in separate files.