In this post we’re looking at the shared target membership information and how to configure warnings for it. This is one of many ways Sw!ftalyzer helps us finding potential areas of improvement in our app.
First, we’ll see how Sw!ftalyzer shows files that are member of more than one target. Next, we’ll explore how to use the warnings feature to find these files right in the dependency graph.
Getting an Overview of Files with Shared Target Membership with Sw!ftalyzer
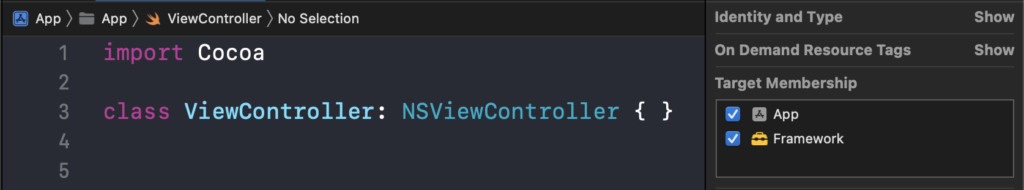
Often we want to share code between modules, e.g. we want to use the same class in our main app target and in a framework. A quick and easy way to do so is to add the file containing the shared code to both targets via the File Inspector Tab in Xcodes Inspectors panel:
However, this approach has a bunch of disadvantages:
- It creates implicit dependencies and makes it easy to introduce unexpected bugs. When changing code in a shared file, it’s easy to miss that the change impacts a different module as well. While changing code in one module, there is a chance of introducing a bug in a seemingly unrelated module.
- It creates complicated and tangled project structures: It’s not clear where to place the file and which test module should contain the unit tests for the code in the file.
A better way of shareing code between targets is to move the file into a separate module and importing this one. This makes the dependencies explizit instead of hiding this information in Xcodes Inspector.
But how can we find files that belong to more than one target? The obvious way is to look through all files and check the list of target memberships. However, this becomes time consuming when there are many files. Sw!ftalyzer offers an automated and easy to use alternative to this manual process.
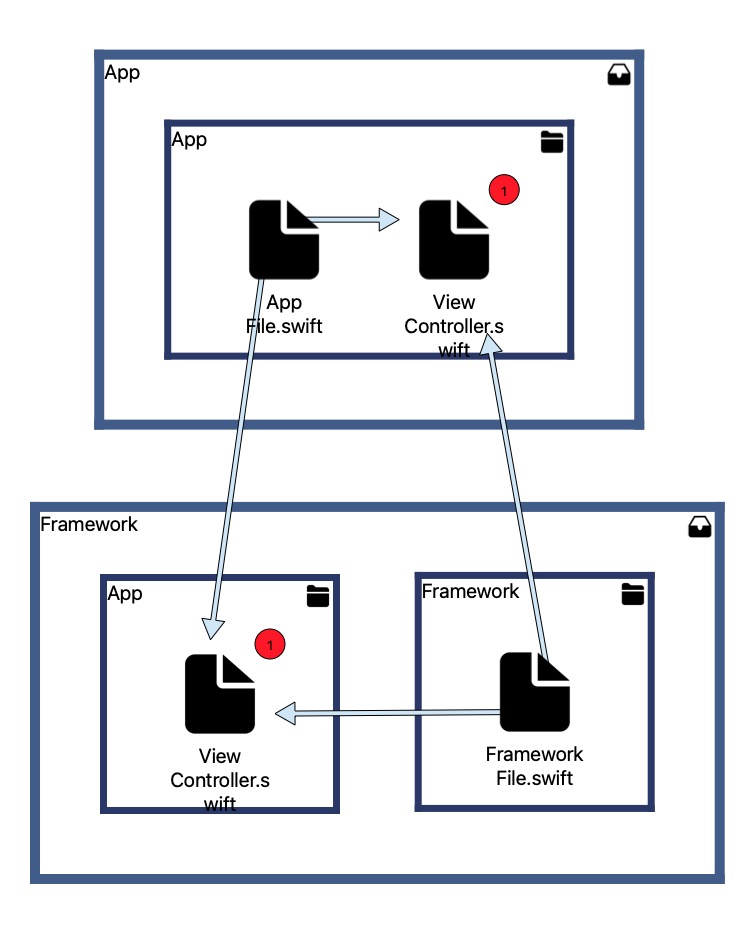
To understand how to use Sw!ftalyzer, we’ll explore a demo project analysis as an example. Download the analysis file and open it in Sw!ftalyzer to see the dependency graph shown below: Demo Project
There are two modules in this project: App and Framework. Each module has a file only belonging to the module, AppFile.swift in case of the module App and FrameworkFile.swift as part of the module Framework. Additionally, there is one file called ViewController.swift. It belongs to both modules and is shared by selecting both targets in the list of target memberships.
AppFile.swift and FrameworkFile.swift both contain a code entity. This entity has a dependency to the class declared in ViewController.swift. There are two arrows pointing from FrameworkFile.swift to both ViewController.swift nodes. Two more arrows lead from AppFile.swift to both ViewController.swift. These arrows represent the dependencies.
Although the project contains only three files, Sw!ftalyzer shows four files. Because both modules share ViewController.swift, it’s part of each of them and thus shown as part of each module. Neither module imports the other one, but the dependency graph still shows dependencies between the them. This is how Sw!ftalyzer makes the implicit connection between the two modules visible. This would have been hard to see in Xcode.
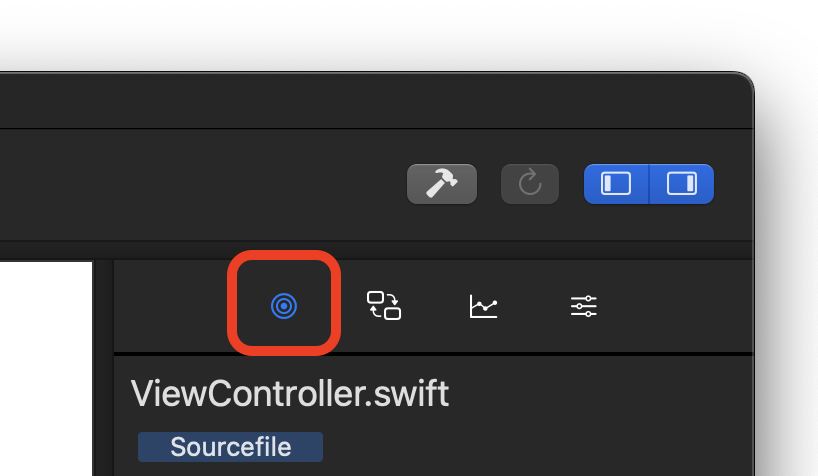
The dependency graph is a great way of getting an overview of dependencies. Another way of finding information about shared files is to go to the selected node tab. It’s the first tab in the right panel and here we can see information about the selected node.
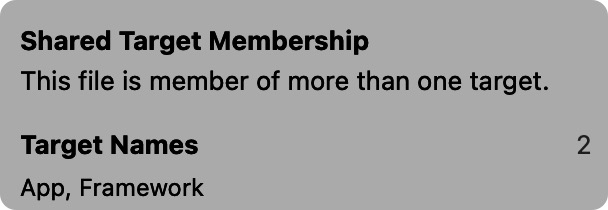
When the selected file is part of more than one target, we see a list of the targets it’s member of. In this example, the selected file ViewController.swift is part of two targets, App and Framework.
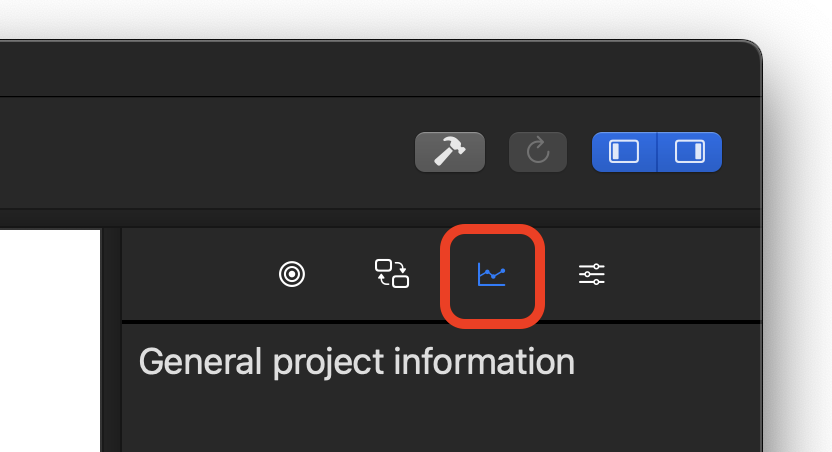
When we want to see a more general overview unrelated to the currently selected file, we can open the third tab in the right panel. This tab shows general project information.
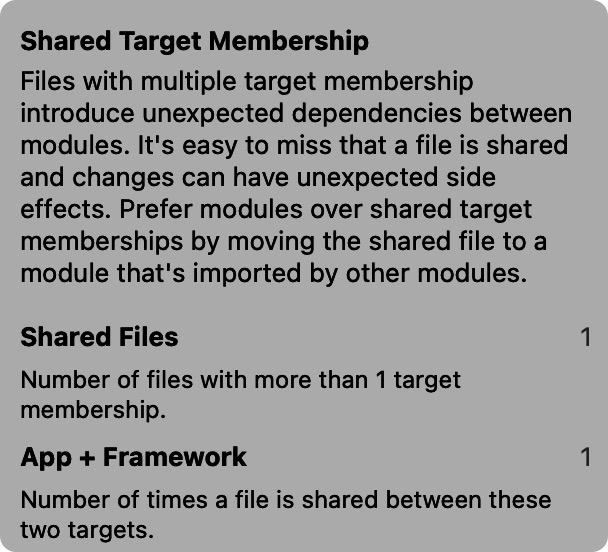
Among other things, we can find a list of all targets that share files in this tab. First, we see how many files are shared in total, in this demo project it’s 1.
Below that information, we see pairs of targets and how many files they share. Here the list is quite short showing only one combination of targets. But in larger projects the list of targets with shared files can grow quickly.
The previous information about shared target memberships focuses on the selected file. In contrast to that, this list highlights the targets that share files.
Configuring Warnings about Shared Target Memberships
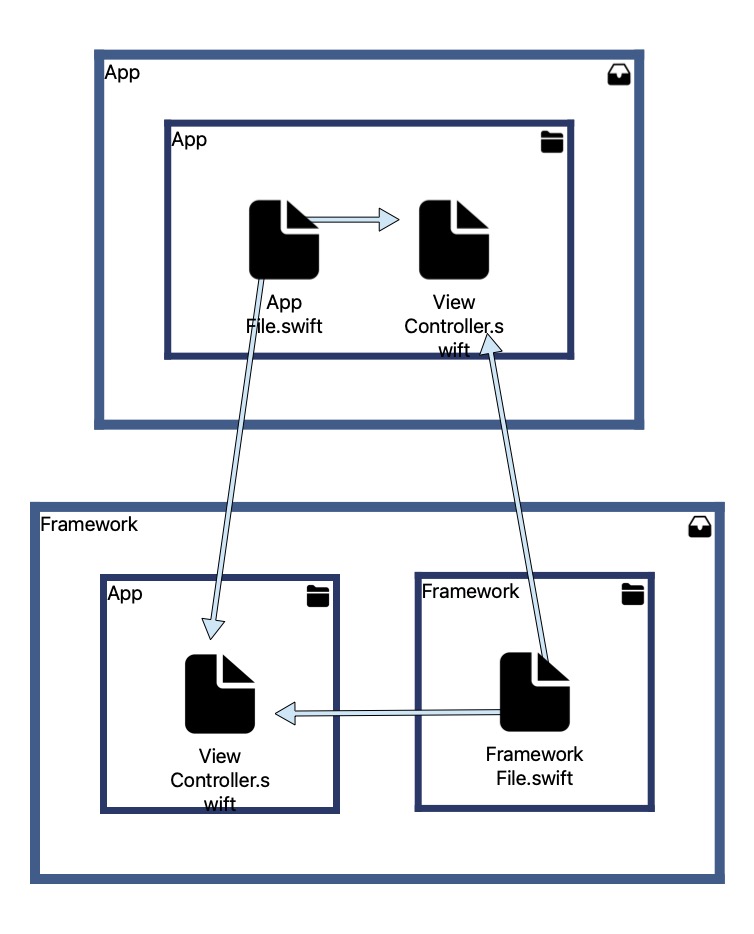
Warnings are a great way of quickly finding areas of improvement in our apps. A file with a warning has a red bubble in the upper right corner of the node that shows the number of warnings.
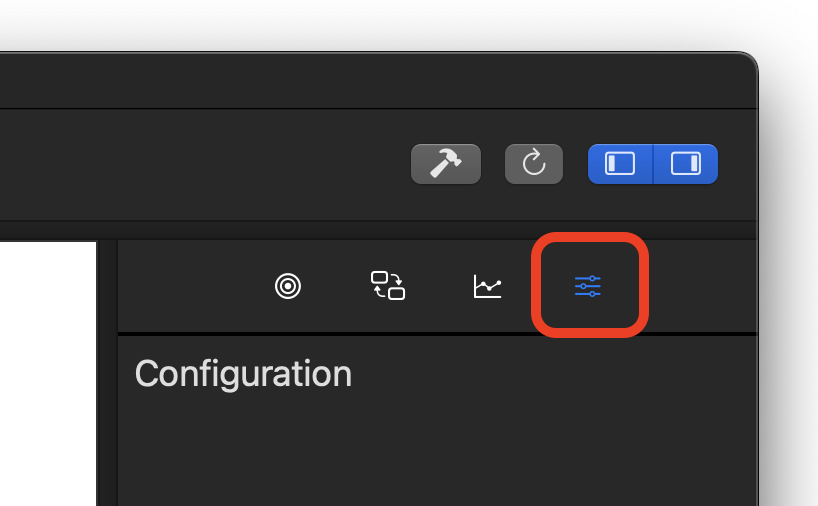
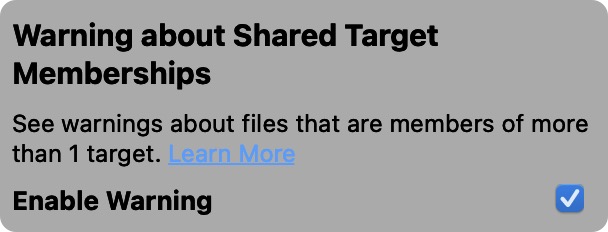
We can configure warnings in the configuration tab. It’s the fourth tab in the right panel, which is highlighted in the image. Select it to see options for various warnings, like the warning about shared target memberships below.
There’s a checkbox to enable or disable the warning. It’s selected by default meaning that Sw!ftalyzer shows a warning next to each file node that is member of multiple targets. Unselecting the checkbox removes all these warnings in the dependency graph.
With this warning enabled, we see indicators at the file that is part of both targets. Sw!ftalyzer shows us shared files at one glance making it easy to find problems quickly.