Calculating the metric Cumulative Component Dependency
The architecture of a software project is often large and complex. This makes it hard to see if a change in the source code reduces or adds more complexity, making the software harder to maintain in the future.
Was the latest feature build the way it was planned? Did the refactoring improve the codes quality or made everything worse? These questions are hard to answer just by looking at the source code.
Metrics provide hard numbers to
In this post you’ll learn more about the metric Cumulative Component Dependency, short CCD, and the related DependsOn and Average Component Dependency (ACD) metrics. You’ll see what they mean, how they are calculated and how Sw!ftalyzer helps you to automate this calculation for you.
Understanding and Calculating CCD & ACD
John Lakos introduced the metric Cumulative Component Dependency in a book about good software design [1]. It’s based on the so-called DependsOn value, which is the number of code entities, to which a given entity has direct or indirect dependencies to.
To find this value, create a dependency graph starting with the code entity for which DependsOn should be calculated as root. The DependsOn value is now the number of code entities in this dependency graph.
Sounds confusion? Let’s look at an example:
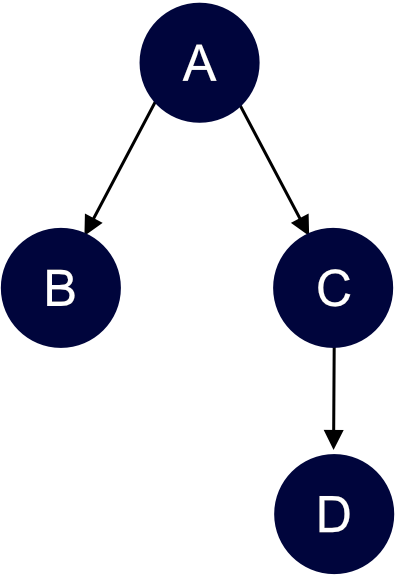
Each blue bubble represents a code entity, in this example the entities A, B, C and D. A directed arrow represents a dependency between the connected code entities.
In this example entity A has a dependency to entity B. In a real project A could be the implementation of a protocol B. A has also a dependency to C, which may be an entity used by A. Finally, C has a dependency to D.
Entity A has dependencies to all other entities, thus the dependency graph starting with A as its root contains all entities. The DependsOn value is 4, 1 for each entity. The entity B has no outgoing dependencies, thus it has a DependsOn value of 1. Same holds for entity D. Entity C has one dependency, thus the DependsOn value is 2.
The metric CCD can now be computed by adding all DependsOn values of a system together. In the example above, the CCD metric is
DependsOn(A) + DependsOn(B) + DependsOn(C) + DependsOn(D)
= 4 + 1 + 2 + 1
= 8
CCD and DependsOn are accompanied by the metric Average Component Dependency, ACD in short. This is the average CCD value per code entity. Looking back at the previous example, ACD is
CCD / #entities
= 8 / 4
= 2.
Interpreting CCD & ACD
One use case of CCD is evaluating the maintainability and testability of a system [2]. It’s especially good in finding cyclic dependencies. Let’s look at an example to see how this looks like:
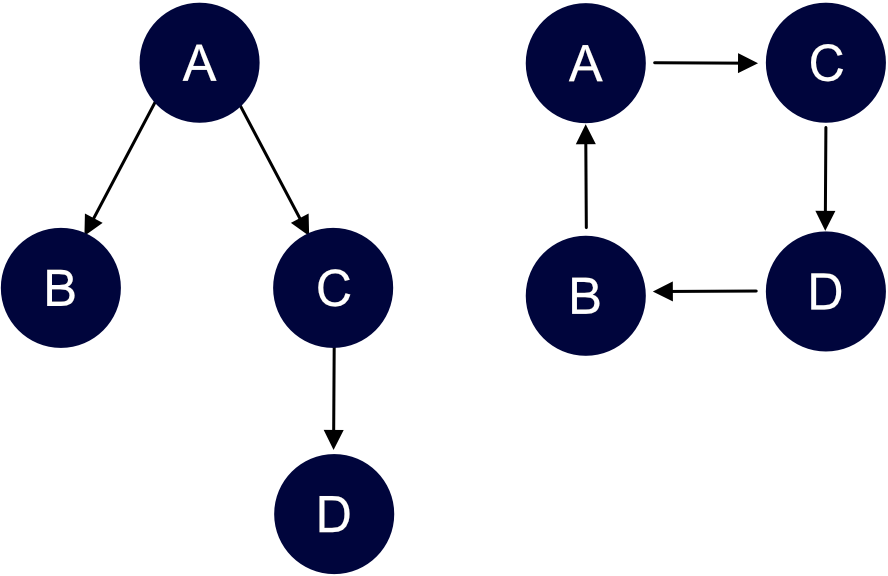
On the left we see the same dependency graph as before. It’s accompanied by another dependency graph, where the dependencies form a cycle.
As a reminder: The left graph has following metrics:
CCD: 8 | ACD: 2
Let’s calculate these values for the cyclic graph. Each sub graph representing the dependency graph with any given node as it’s root contains all 4 nodes. Thus each code entity has a DependsOn value of 4. This leads to following metrics:
CCD: 4 + 4 + 4 + 4 = 16 | ACD: 16 / 4 = 4
Although both graphs have the same number of entities, CCD and ACD are much higher for the cyclic one. This way we can find newly introduced cyclic dependencies by comparing these metrics before and after a new change.
Let’s say CCD is 100 and ACD is 5 for a given system. If a new feature changes these values to CCD of 400 and ACD of 16, a new cyclic dependency was introduced to the project.
Analyzing CCD with Sw!ftalyzer
These values are hard to calculate by hand. You had to find and count each dependency between your code entities. This would be time consuming and error prone. Thus we need a way to automate this.
Sw!ftalyzer can do more than visualizing your project. Various metrics are calculated and displayed to provide deeper inside into your code — including DependsOn, CCD and ACD.
Once your project is analysed and all metrics are calculated, you can find these metrics in the information panel:
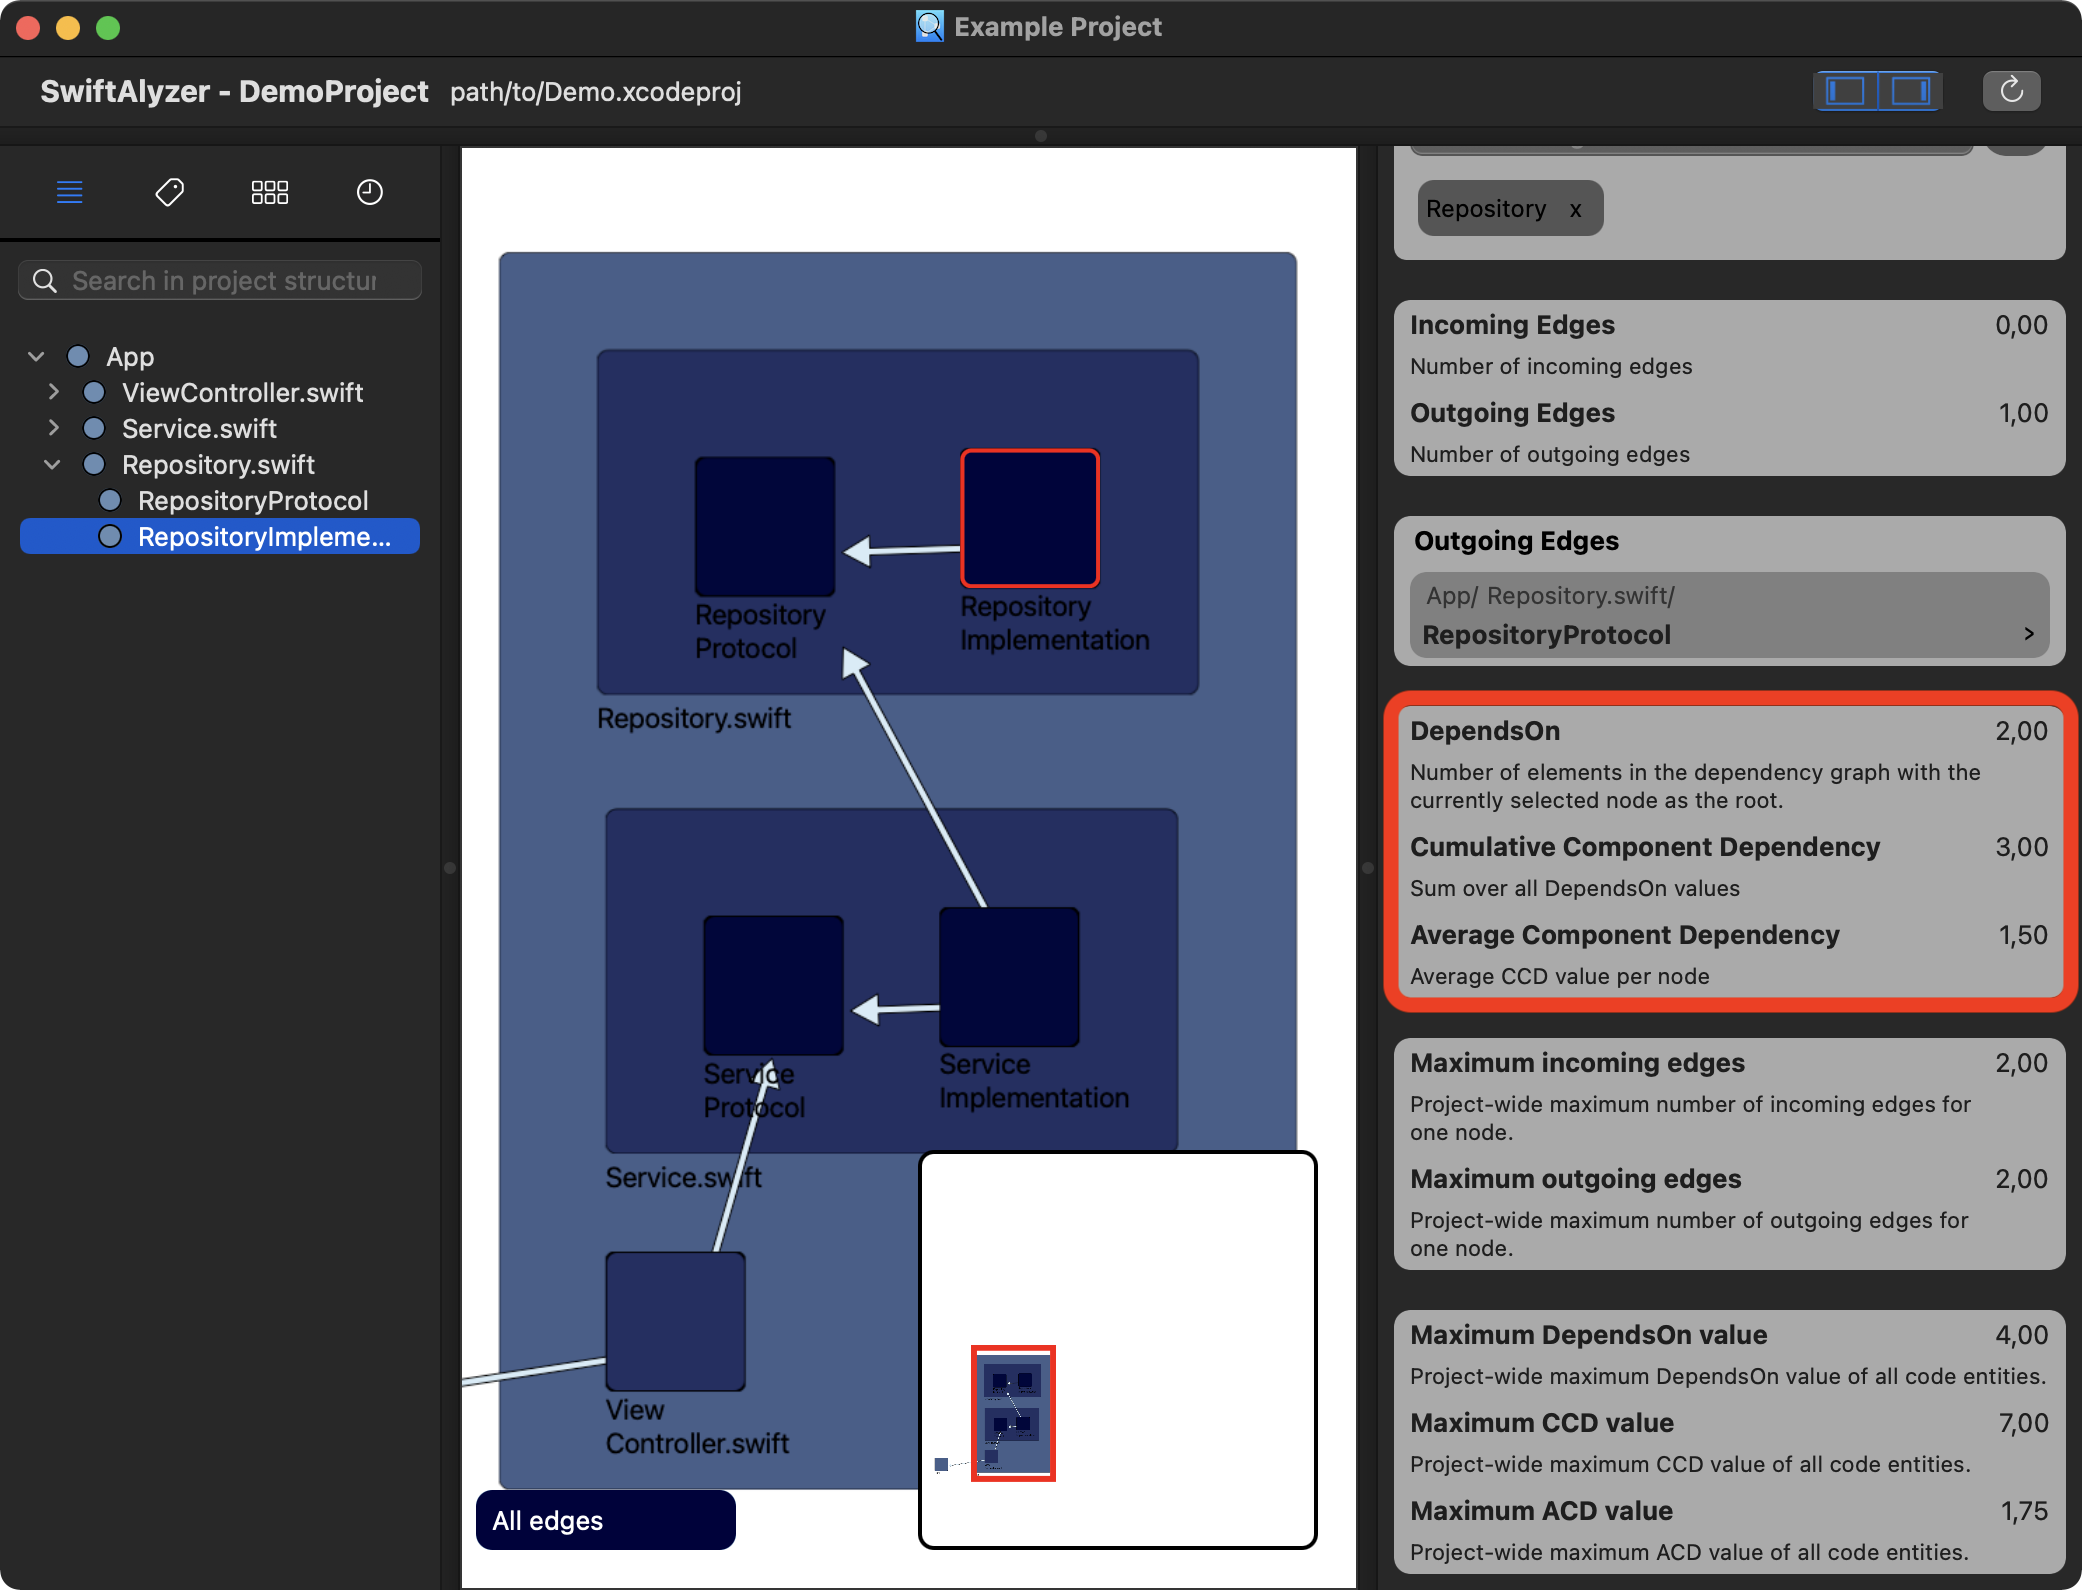
You can find the values of DependsOn, CCD and ACD for the selected node RepositoryImplementation. The entity has one outgoing dependency to RepositoryProtocol, thus the DependsOn value is 2.
The entity RepositoryProtocol has no outgoing dependencies, thus its DependsOn value is 1. We calculate the CCD value by adding these DependsOn values together, which is 3. ACD is then calculated by dividing this number with the number of entities, resulting in 1.5.
Summary
- The metric CCD is related to DependsOn and ACD.
- These values indicate cyclic dependencies, if compared over time.
- Calculating them for one entity is easy, but analysing a whole project is a lot of work and error prone.
- Sw!ftalyzer calculates CCD, DependsOn and ACD for each entity automatically.
Sources
[1] Lakos, John: Large-Scale C++ Software Design. Addison-Wesley Publishing Com- pany, Massachusetts, 3. Auflage, 1996.
[2] Andrea Baruzzo: How testable is a software architecture? https://baruzzo.wordpress.com/2009/08/22/how-testable-is-a-software-architecture/