Instability measures the relative susceptibility to breaking changes of a software component. It’s closely related to coupling and puts the number of outgoing dependencies in a relation to the number of incoming dependencies.
It quantifies the balance between flexibility and stability. A high instability (close to 1) reflects many outgoing dependencies and thus a high coupling. This shows that it’s very dependent on other components. A low instability (close to 0) relates to a low outgoing coupling, meaning that the component is more self-contained and less likely to be affected by external changes.
While some coupling is unavoidable, the metric encourages careful design to minimize unnecessary dependencies. Especially core modules benefit from low instability to prevent cascading effects in case of changes.
Instability is one of the so-called Software package metrics and is described by Robert C. Martin in his book “Clean Architecture”.
Calculating Instability
As Instability is the relation of incoming and outgoing dependencies, called “Fan-In” and “Fan-Out” respectively, we need to count these first. These only include dependencies between different modules, so dependencies between code entities within the same module are ignored.
Once we have the Fan-In and Fan-Out, Instability is calculated with this formula:
Instability = Fan-Out / (Fan-Out + Fan-In)
Take a look at this example:

| Name | Component Type | Fan-In | Fan-Out | Instability |
|---|---|---|---|---|
| Ca | module | 0 | 2 | 1 |
| q | entity (class) | 0 | 1 | 1 |
| r | entity (class) | 0 | 1 | 1 |
| Cb | module | 0 | 1 | 1 |
| s | entity (struct) | 0 | 1 | 1 |
| Cc | module | 3 | 1 | 1/4 |
| t | entity (enum) | 1 | 0 | 0 |
| u | entity (class) | 2 | 1 | 1/3 |
| Cd | module | 1 | 0 | 0 |
| v | entity (protocol) | 1 | 0 | 0 |
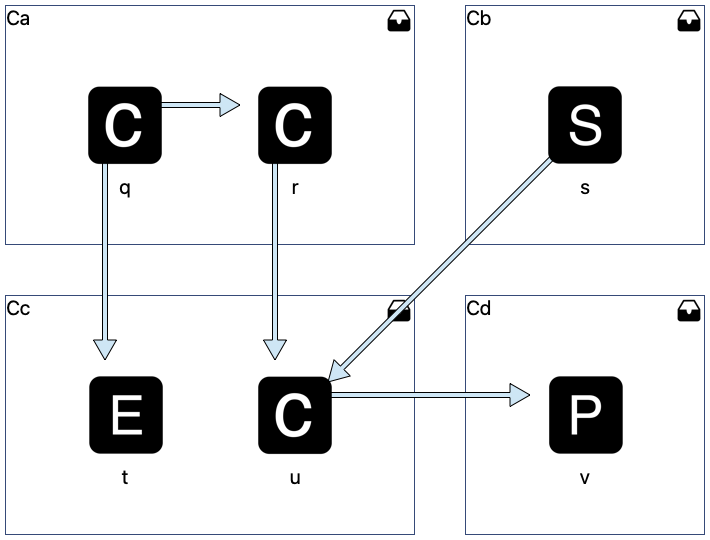
The nodes Ca, Cb, Cc and Cd represent modules and the nodes q, r, s, t, u and v are code entities of different types. The edges between the nodes represent dependencies, e.g. the class q depends on class r.
Class q has 2 outgoing dependencies, one to the class r in the same module and one to the entity t in the module Cc. As dependencies within the same module are not relevant for calculating Instability, this dependency is ignored. Thus the Fan-Out of class q is 1, because of the dependency to enum t. Without any incoming dependencies its Fan-In is 0. The Instability of q is Instability(q) = Fan-Out(q) / (Fan-Out(q) + Fan-In(q)) = 1 / (1 + 0) = 1. This means that class q has the highest possible Instability. Looking at the graph this seems obvious, the dependency to enum t may require it to change and without any incoming dependencies, there are no reasons preventing it to change.
Class r has 1 incoming dependencies from class q, but as q and r are part of the same module this dependency doesn’t increase the Fan-In of r and it stays 0. Because of the outgoing dependency to class u in the module Cc, r has a Fan-Out of 1. With these values it has the same instability as q.
Fan-In and Fan-Out of a module are based on the dependencies of all entities within this module. Ca has 2 outgoing dependencies to entities in other modules, one from q to t and one from r to u, so the Fan-Out is 2. With 0 incoming dependencies from entities of other modules, its Fan-In is 0. The Instability of Ca is 2 / (2 + 0) = 1.
The module Cc contains the enum t and the class u. t has 1 incoming dependency from the class q in module Ca, but no outgoing dependencies. Its Fan-In is 1, its Fan-Out is 0 and its Instability is 0 / (0 + 1) = 0. t has the lowest possible Instability, as it has no outgoing dependencies there’s no other entity of which changes would require t to change. The incoming dependency discourages changes, because class s may need to change in case of changes to t.
Class u has 2 incoming dependencies from class r in module Ca and struct s in module Cb and thus a Fan-In of 2. Because of the 1 outgoing dependency to protocol v in module Cd, its Fan-Out is 1. The Instability of u is 1 / (2 + 1) = 0,333 meaning that u is more stable than unstable.
Fan-In, Fan-Out and Instability for all other modules and entities can be seen in the table next to the graph above.
Analyzing Instability with Sw!ftalyzer
The instability metric helps developers design systems that are both adaptable and reliable. By integrating this metric into your workflow, you can make informed decisions, leading to long-lasting, high-quality software.
Sw!ftalyzer automatically calculates and visualizes the instability of modules and code entities.
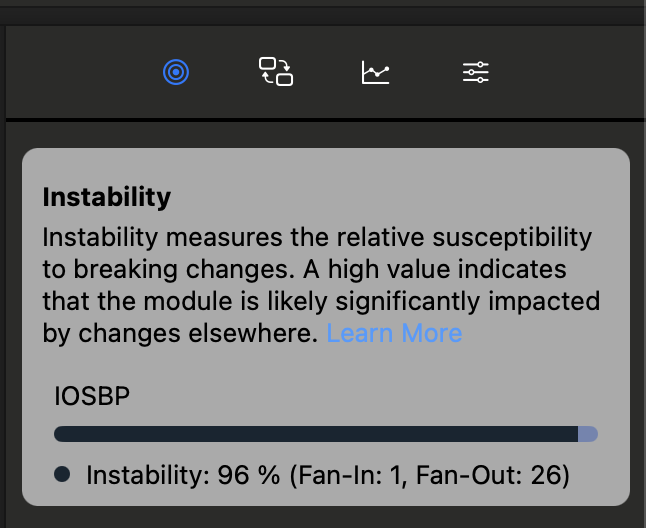
Find Instability together with Fan-In and Fan-Out for the selected node in the first tab of the information panel on the right. This is shown in the first screenshot to the right.
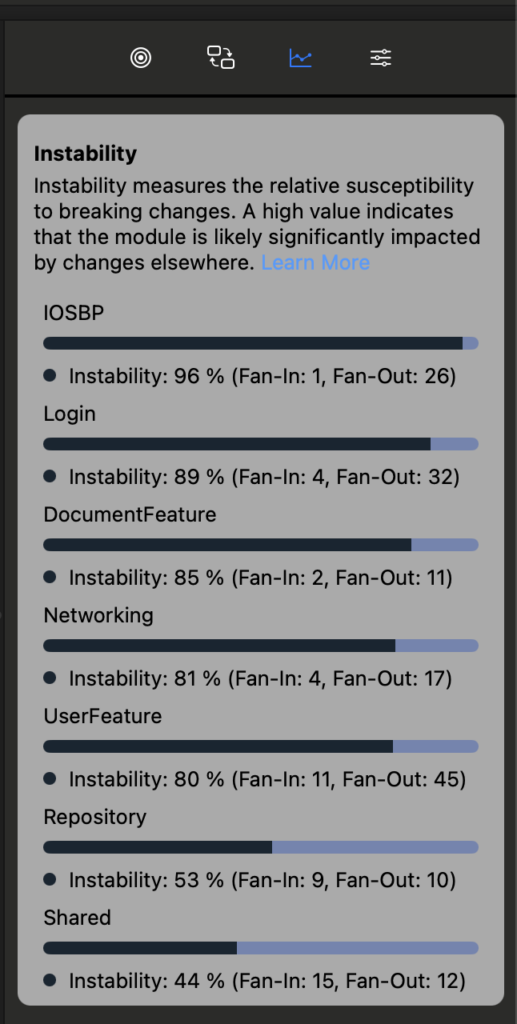
The third tab of the same panel shows project wide metrics and statistics. Here you see an overview of Instability values for all modules in the project. This looks like in the second screenshot to the right.
Finally, you can find these values and many more in the “Metrics & Statistics” csv file. You can export this file via the export menu shown in the last screenshot below.


